We are located in Prescott, Arizona at an elevation of 5,400 feet (1,600 m) MSL. In the summertime, density altitudes in the area can reach in excess of 8,000 ft. In aviation, density altitude is used as an indicator of aircraft performance. Essentially the higher and hotter you are, the less aerodynamic performance you can expect from your aircraft, even from small drones. What this means for most users is less flight time.
Most of our testing takes place around Prescott in high altitude conditions. Our endurance numbers are calculated and quoted from our testing environment, but we are always curious how much more we could get at lower altitudes. Most manufacturers quote performance at sea level conditions on a perfect day.
With the hand-launch version of Lynx, we managed to fly an extra 23 minutes at sea level in Perth, Australia during a demonstration flight. The flight clocked-in at 3 hours, 23 minutes aloft. That 23 minute boost in flight time is longer than the max endurance of most copters. Based on that experience, we wanted to see what additional time we could get with Lynx VTOL.
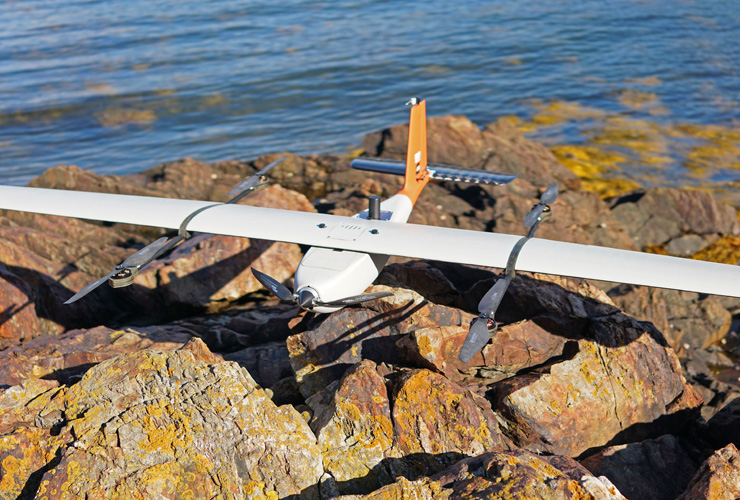
With the help of MetaVR, a long-time business partner, we arranged travel and a test site in Owls Head, Maine. Testing took place adjacent to the Atlantic Ocean at an elevation of 10 feet.
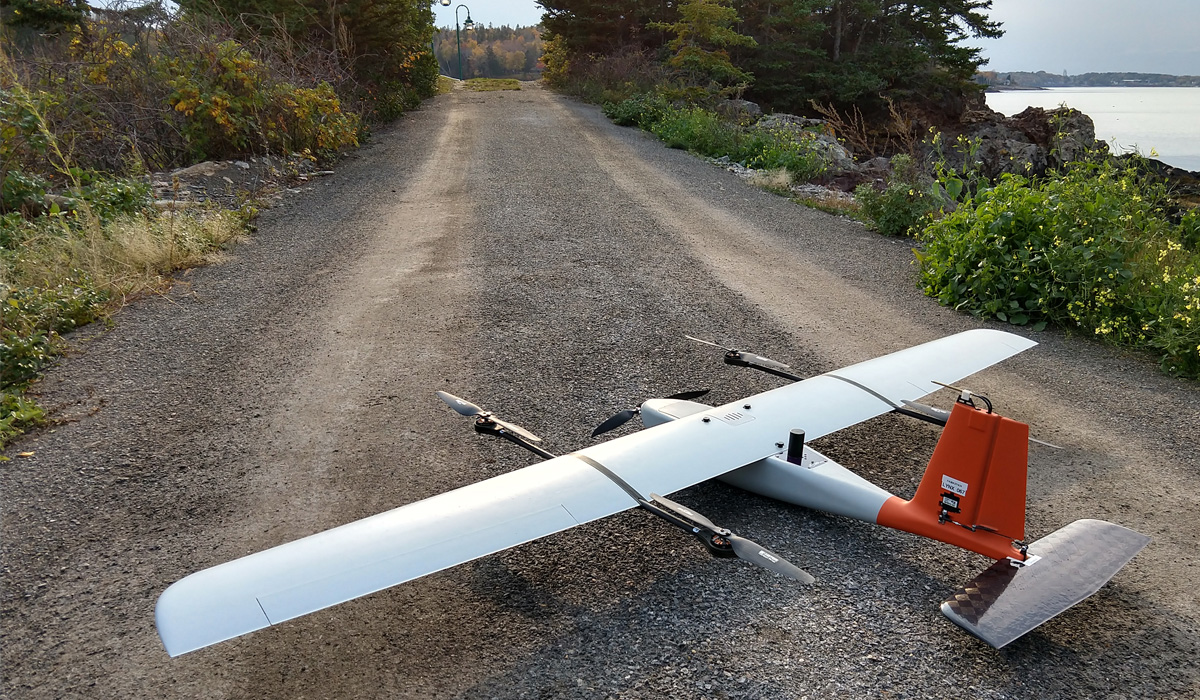
Testing right next to the ocean.
High winds and rain plagued us the entire trip, but we did manage to get a handful of important flights in. On the 2nd day of flying, we set up to do an endurance flight with a 500 gram dummy weight, enough to cover most mapping and live-video payloads.
The aircraft autonomously lifted off adjacent to a tree line and, upon nearing the top of the trees, began to struggle to climb. This was obviously cause for alarm and something we had never experienced before. Certainly if we were to have performance issues they would have manifested at high altitudes, not next to the ocean. The safety pilot aborted the takeoff and landed safely, just as it began to rain.
We retreated back to the car and analyzed the autopilot log. The log showed that the four VTOL motors had started to saturate during the climb, meaning that the motors were momentarily maxing out trying to climb and maintain attitude. The payload weight was blamed at first, maybe the aircraft was too heavy? However the same payload had flown at higher altitudes in Prescott with no problems, so weight was ruled out as being the issue.
The issue turned out to be high winds causing a considerable down draft as it blew across the tree line. The wind was probably intensified by the weather front moving in, which caused the rain right after landing.
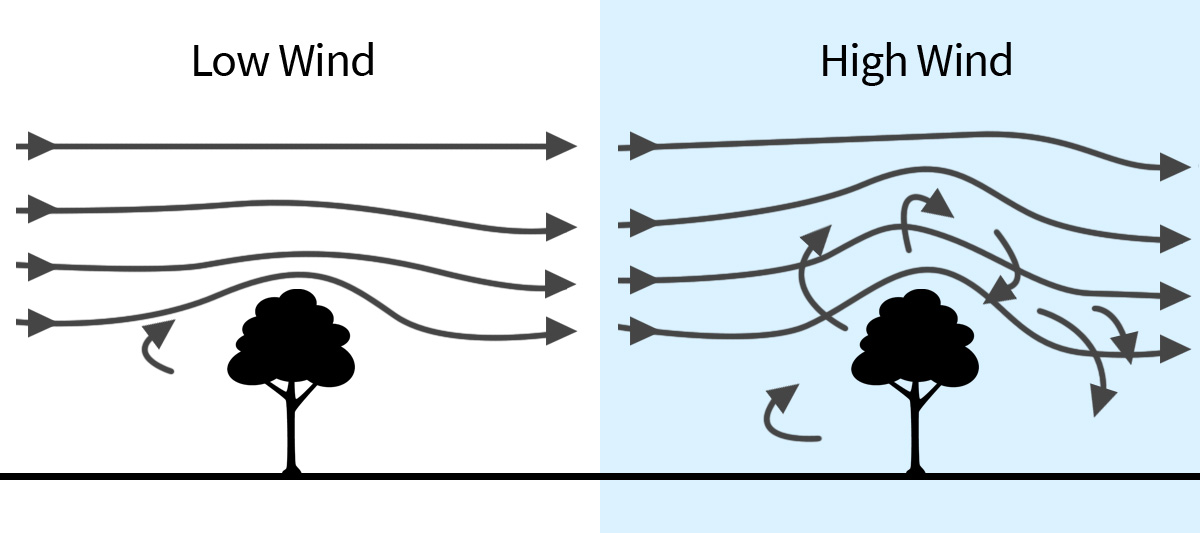
Wind flowing over ground obstacles, such as trees and structures, can cause significant vortices on the leeward side. On takeoff, Lynx VTOL automatically weathervanes into the wind. There are a number a reasons for this, but ultimately a VTOL takeoff is not that different from a normal takeoff; you always want a headwind. Thanks to the weathervaning, we were able to look at the airspeed sensor data to get the wind speed while the aircraft hovered during takeoff. The wind reading rose as the aircraft climbed and peaked at 23 knots (12 m/s) at an altitude of 39 feet, corresponding to the height of the tree line. 23 knots is only slightly beyond the Lynx VTOL wind limit of 20 knots, but it is important to remember than an airspeed sensor only measures incoming air. Vertical moving airflow would not register on the pitot tube.
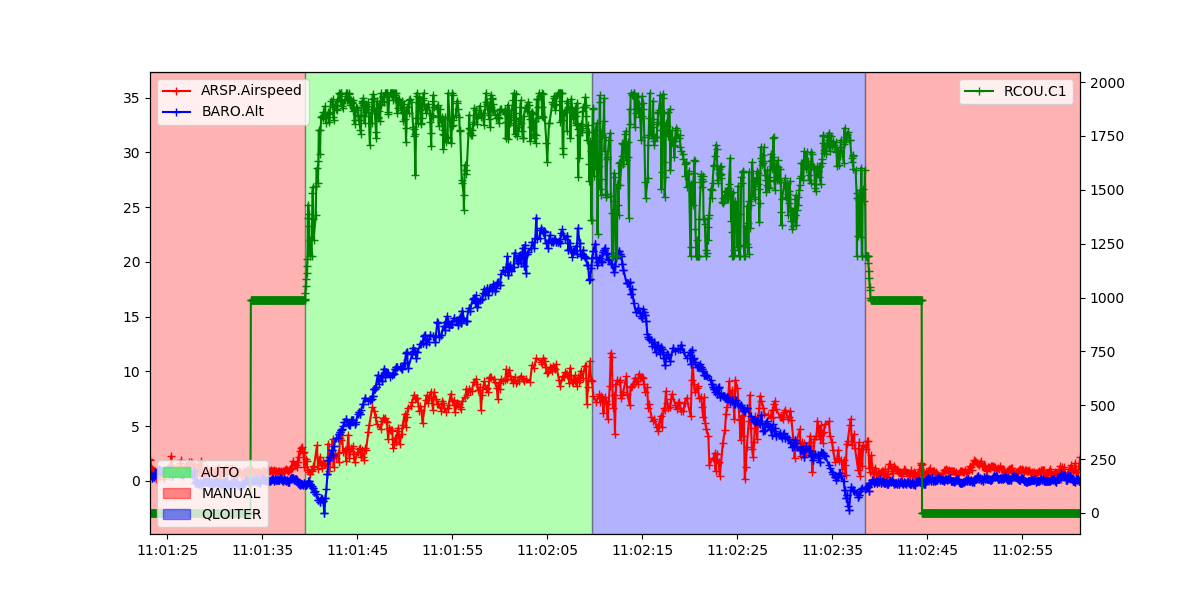
The wind speed (red, in meters per second) goes up as the aircraft climbs. Altitude is shown in blue in meters. At the peak of the climb, the safety pilot takes over and lands the aircraft (purple background).

Here we can see just how quickly the wind velocity rose. The wind goes from calm on the ground to 12 m/s over the course of a 30 second climb.
The weather eventually calmed down that afternoon and we managed to get in 94 minute flight before landing early due to sunset, leaving the batteries with roughly 40% remaining capacity.
Redemption would have to wait until the 4th day due to rain. Our final flight lasted 2 hours and 3 minutes with an early landing due to high winds, not low battery. The weather station at the local airport reported wind gusts of 31 knots! Log analysis on this takeoff showed minimal motor saturation, further pointing to turbulent air as the cause of the aborted takeoff. Both flights carried the same payload weight.
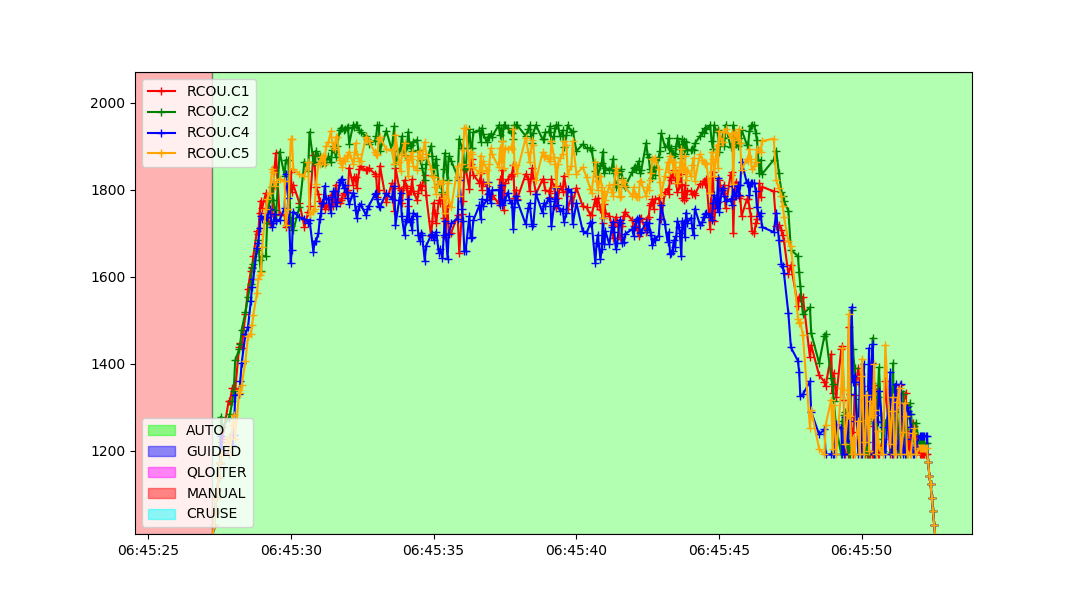
The throttle output of the four vertical lift motors during takeoff of the final 2 hour flight. While throttle output is high during the climb (as expected), we do not see motor saturation or flatlining of the output channels.
While an exact sea level endurance number will have to wait, these tests were still a big milestone for us and Lynx VTOL. We estimate the remaining capacity left on the battery could have continued the flight for another 20 minutes. Plus, there is potentially even more flight time to be unlocked after further propeller optimization. As with the hand-launched version of Lynx, Lynx VTOL is poised to lead the industry in terms of flight endurance for electric VTOL drones.
All flights were performed within 14 CFR Part 107 regulations and flown by FAA licensed pilots with an FAA registered aircraft.